FINANCIAL INFOGRAPHICS
Visual, shareable and engaging infographics.
Growing Library of Sharable Infographics
FreshPlan combines over 75 financial calculators with a growing library of over 75 engaging financial infographics that illustrate a vast array of financial planning topics.
Communicate Complex Concepts
Not everyone has the time or desire to read long-form content. Financial Infographics are an effective way to take complex ideas, filled with data and facts and simplifying the story using with visuals. In fact, when clients and prospects gain insights quickly, the content is more memorable.
Stay Connected Year-Round
Financial infographics are a valuable tool to help stay connected to clients and prospects all year. Whether on social media, email, or as part of a financial plan, they’re a great way to share information with others. Current and topical, each infographic is easy to share on their own or as part of a financial plan.

Tax Loss Selling
Discover what tax loss selling is, the benefits for investors, the superficial loss rule and 2024 deadlines.

Donor Advised Funds Infographic
Donor Advised Funds offers Canadian investors a strategic, tax-efficient, and flexible tool for charitable giving.

TFSA Infographic
2025 Tax free savings accounts offer tax advantages for both long term and short term goals.
FEATURED INFOGRAPHIC
Money Dates 2025
This 2025 infographic is a reference of important Money Dates
of when returns are due to be filed, payments are due and benefits are paid.
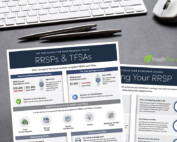
RRSP and TFSA Infographic
This 2025 TFSA and RRSP infographic illustrates that often saving for the future involves using both RRSPs and TFSAs.
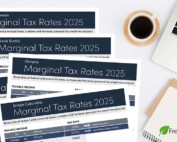
Marginal Tax Rates Infographics
Marginal Tax Rate infographics outline 2025 marginal tax rates taking all federal and provincial taxes, surtaxes and the basic personal tax credit into account.

Registered Plan Limits Infographic
This Registered Plan Limits Infographic is a convenient guide for the 2025 contribution limits of various registered plans.
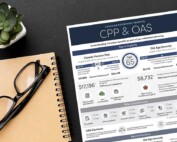
CPP & OAS Retirement Benefits
This 2025 CPP and OAS Retirement Benefits Infographic illustrates considerations about amounts, eligibility, applying for benefits and taxation.
Share financial infographics to attract attention and increase engagement.

Lifelong Learning Plan
The Lifelong Learning Plan allows individuals to withdraw money from their RRSPs to finance full-time training or post-secondary education.

Credit Score Infographic
This credit score infographic illustrates the factors involved in determining your credit score, and why a good score is important.
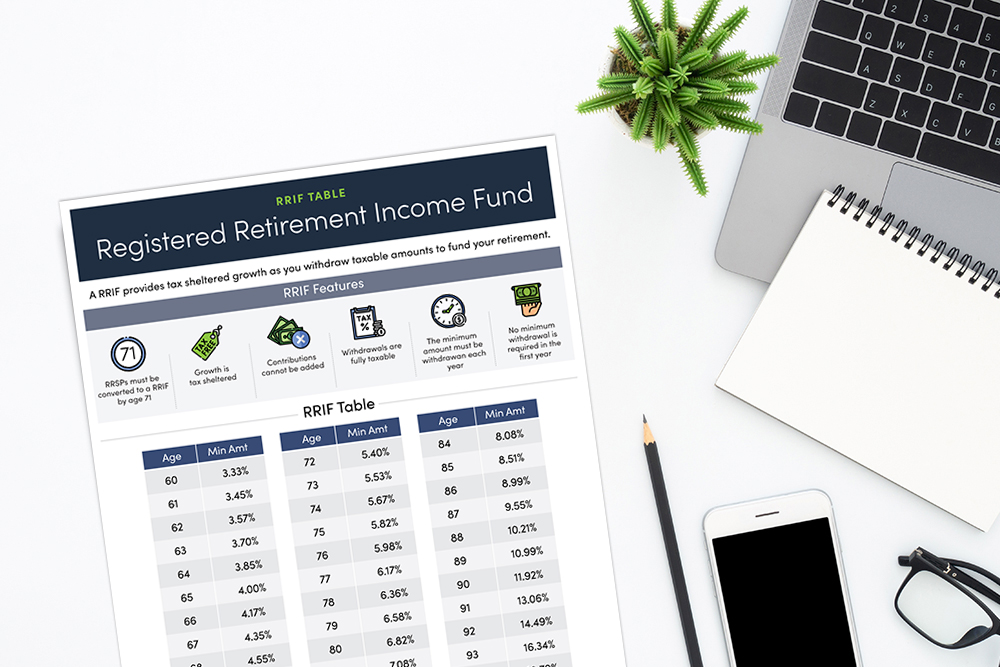
RRIF Amounts Table
Quickly access the minimum amounts from age 60 to age 95+.
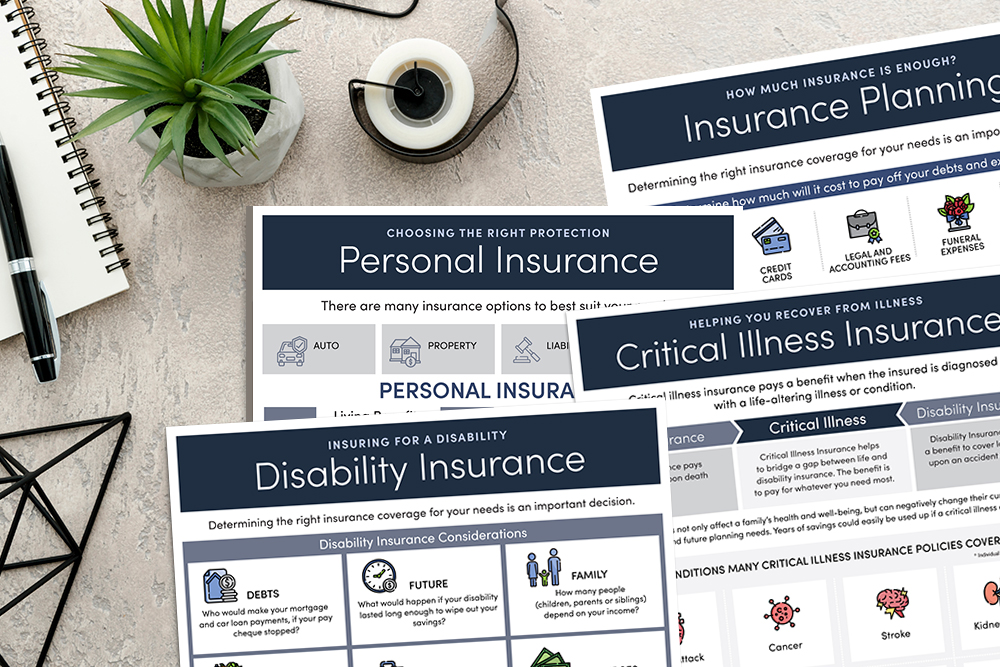
Personal Insurance Infographics
This series of personal insurance infographics highlight the many insurance options to best suit your clients’ needs.
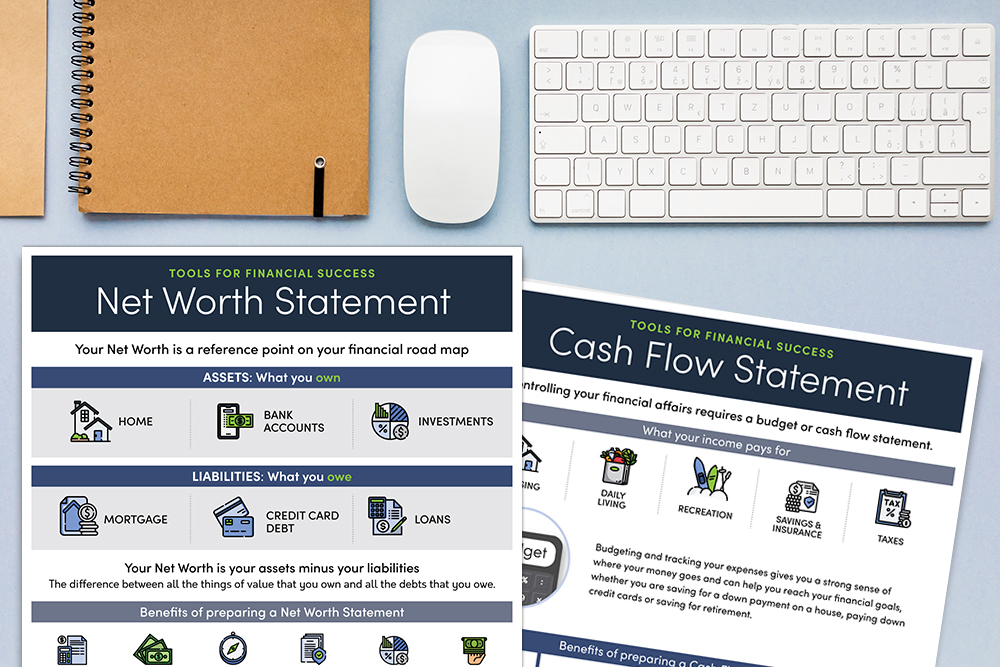
Cash Flow Statement Infographic
This FreshPlan infographic outlines how you can control your financial affairs through a cash flow statement.
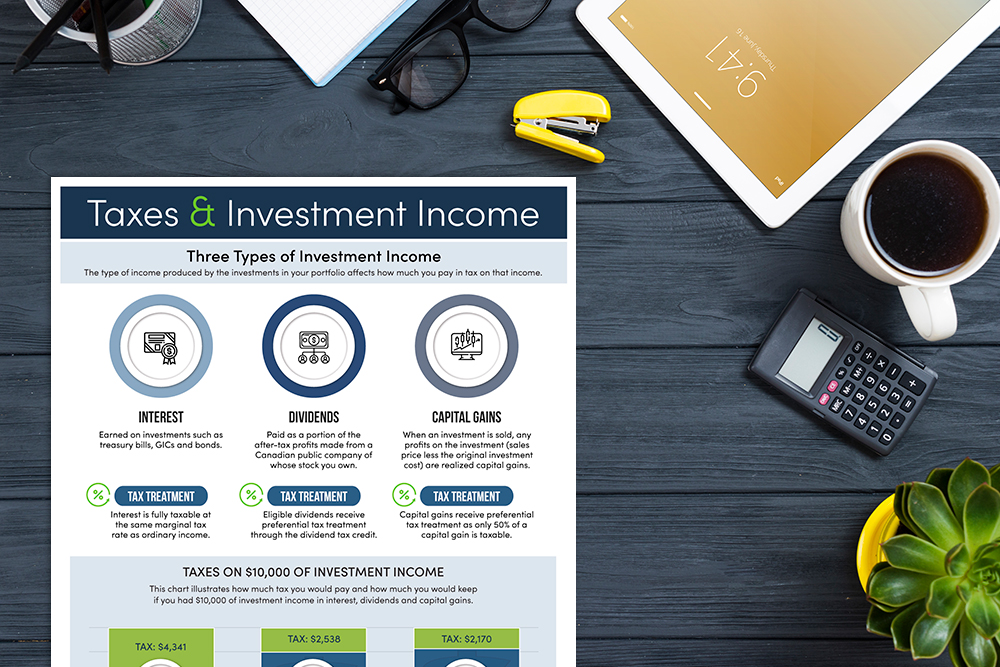
Taxes and Investment Income
Taxes and investment income infographic illustrates various income producing investments and the impact of taxation.