Dollar Cost Averaging Infographic
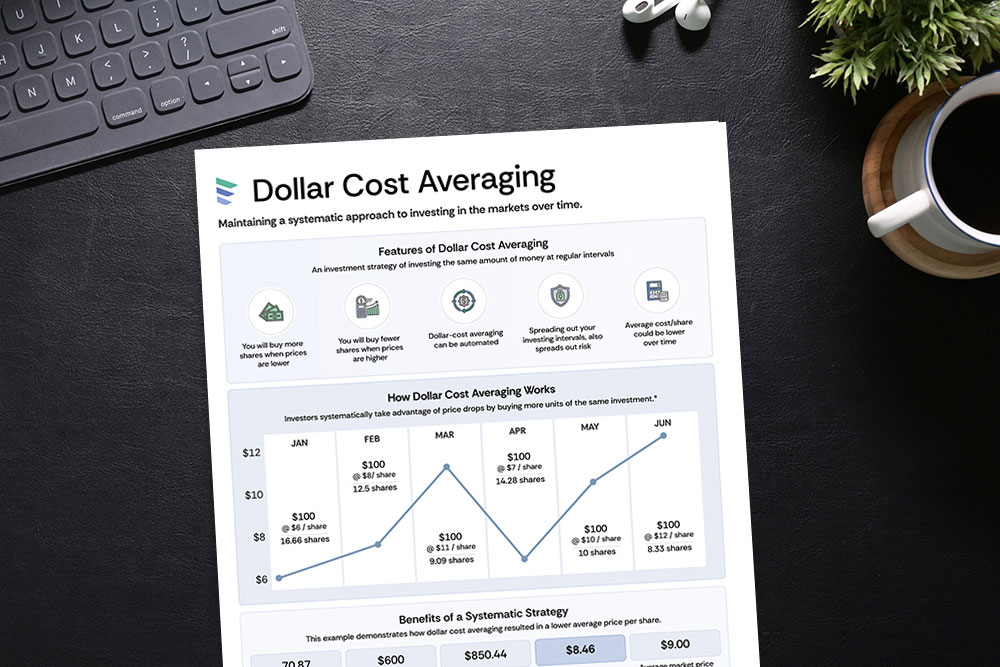
This Dollar Cost Averaging infographic explains how the DCA investment strategy works in a simple, visual way. By consistently investing a fixed amount at regular intervals, you can lower the average cost per share over time.
For example, if you invest $100 each month in a stock, you’ll end up buying more shares when prices are lower and fewer when prices are higher. This helps smooth out the effects of market fluctuations and avoids the challenges of trying to time the market. It’s a practical, steady approach to investing that can lead to more balanced and potentially less stressful long-term growth.
“Spreading out intervals of investments also spread out risk.”
A Systematic Approach
Dollar cost averaging is a smart strategy because it brings a systematic, disciplined approach to investing – something especially valuable in volatile markets. By investing a fixed amount at regular intervals, you can take advantage of market dips, buying more shares when prices are lower and fewer when they’re higher. This reduces the risk of putting a large sum into the market at the wrong time and helps you build your investment position gradually. The Dollar Cost Averaging infographic clearly illustrates this principle, making it easier to see how this strategy can work to your advantage over time.
Connecting with Clients
For financial advisors, using this infographic with clients is a strategic way to educate them about the benefits of dollar cost averaging. The visual nature of the infographic makes it easier for clients to understand how regular, consistent investments can lead to a lower average cost per share, especially in fluctuating markets. By sharing this resource, advisors can start more informed discussions about investment strategies, help clients make more confident decisions, and reinforce their role as knowledgeable guides in managing investments. This approach not only enhances client education but also strengthens the advisor-client relationship by demonstrating a commitment to effective, long-term financial planning.
Investing Planning Calculators
Investment planning calculators help to map out an investing strategy, which may include dollar cost averaging. These calculators offer insights into different financial situations and strategies, highlighting the importance of an investment strategy that takes into consideration goals, risk tolerance, rates of return and diversification.
Infographic Features
- Communicate complex concepts with vibrant, sharable, easy-to-understand infographics
- Personalized for individual Advisors
- Current and timely for client communications
- One of many infographics included in FreshPlan software
Calculate. Educate. Plan.
Communicate complex concepts from all areas of financial planning with current, visual infographics.
FreshPlan combines 75 calculators with powerful infographics and planners to provide advisors with a visual, easy-to-use, time saving planning and education tool and can be accessed anywhere, anytime using any device – phone, tablet, iPad, laptop or desktop.

