
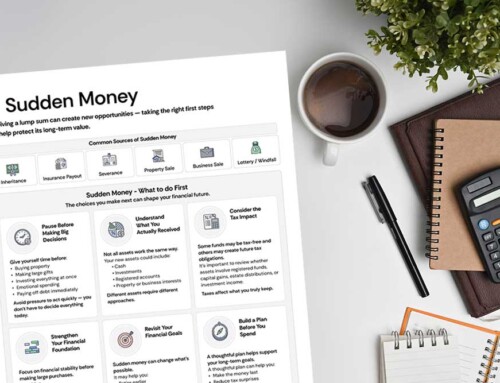
Understanding Mutual Funds Infographic
A Clear, Visual Way to Explain the Basics
Mutual funds are one of the most common investment solutions Canadians use—and one of the most misunderstood. Clients often hear terms like diversification, professional management, and market risk, but those ideas don’t always click without a clear visual.
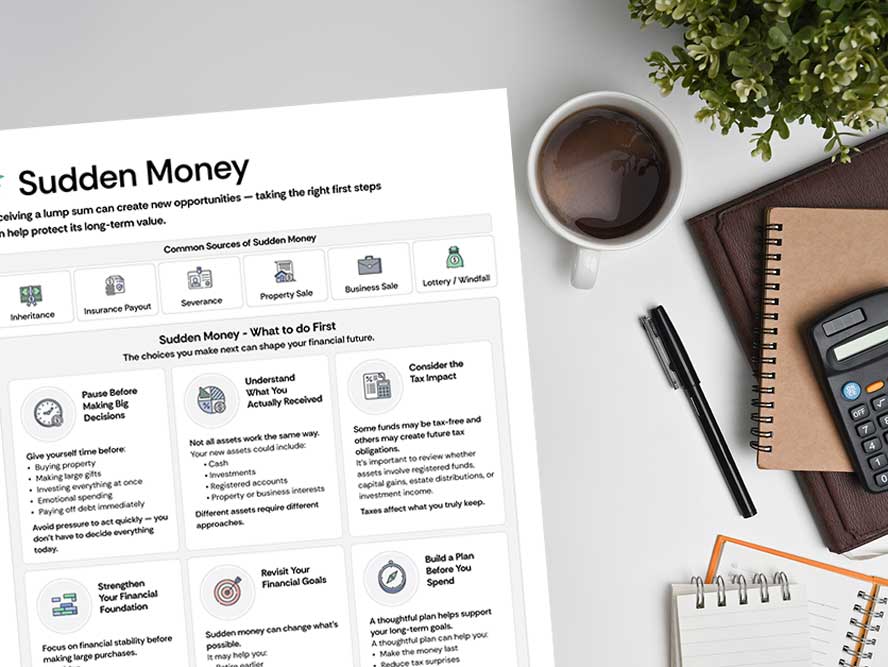
This infographic breaks down how mutual funds work in a simple, logical flow that clients can grasp quickly. It shows how individual investors pool their money, how those funds invest across many securities, and how returns cycle back to investors over time.
This infographic breaks down how mutual funds work in a simple, logical flow that clients can grasp quickly. It shows how individual investors pool their money, how those funds invest across many securities, and how returns cycle back to investors over time.
Instead of explaining the mechanics verbally—or worse, relying on industry jargon—you can point to a clean visual that does the heavy lifting for you.
Great for Early Conversations
The infographic works especially well during early conversations. New investors often want reassurance before they want performance numbers. By visually illustrating diversification, professional management, and liquidity, the infographic helps clients feel more comfortable before they commit capital. It answers common questions like Where does my money go?, Who manages it?, and How do I get my money back if I need it?
Demonstrate the Benefits
The benefits section reinforces the practical advantages clients care about most. It highlights affordability, diversification, professional oversight, daily liquidity, and strong Canadian regulation. These aren’t abstract concepts—they’re the reasons mutual funds continue to play a role in long-term financial plans. When clients see these benefits presented clearly and neutrally, they tend to engage more openly and ask better questions.
Build Trust
This infographic also supports ongoing client education. You can share it digitally, include it in review packages, or revisit it during market volatility to remind clients how diversification and long-term investing work together. Because the tone stays educational—not promotional—it builds trust rather than defensiveness.
Most importantly, the infographic positions you as a guide. You’re not pushing a product; you’re helping clients understand how an investment vehicle works and where it fits within their broader plan. That clarity strengthens relationships and leads to more confident, informed decisions.
If your goal is to simplify complex topics without oversimplifying the truth, this infographic gives you a reliable, professional tool you can use again and again.