VISUAL ASSETS
Financial Infographics that Speak Volumes
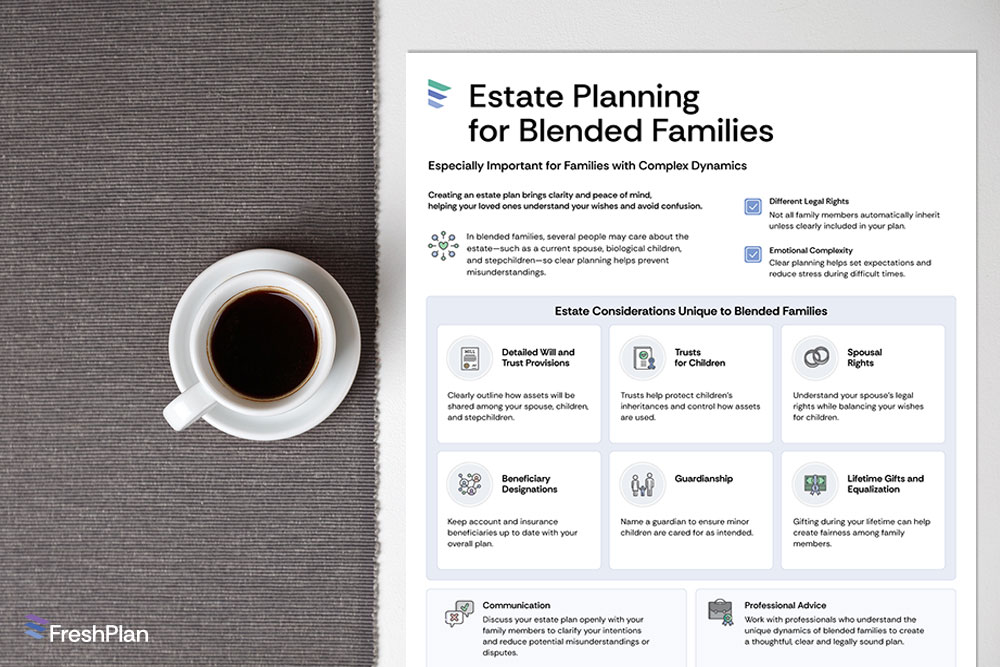
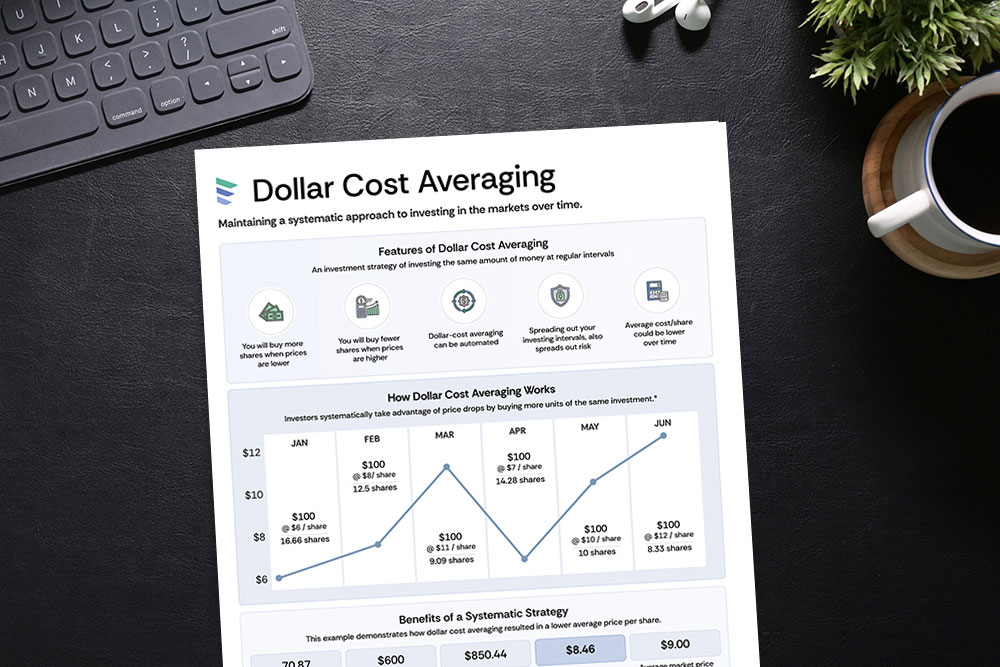
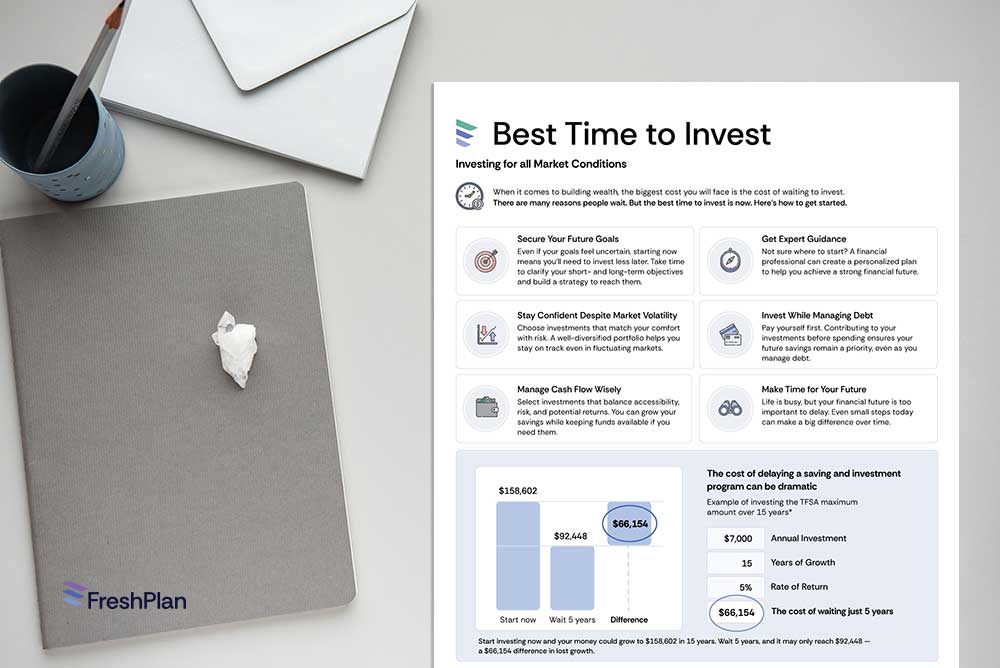
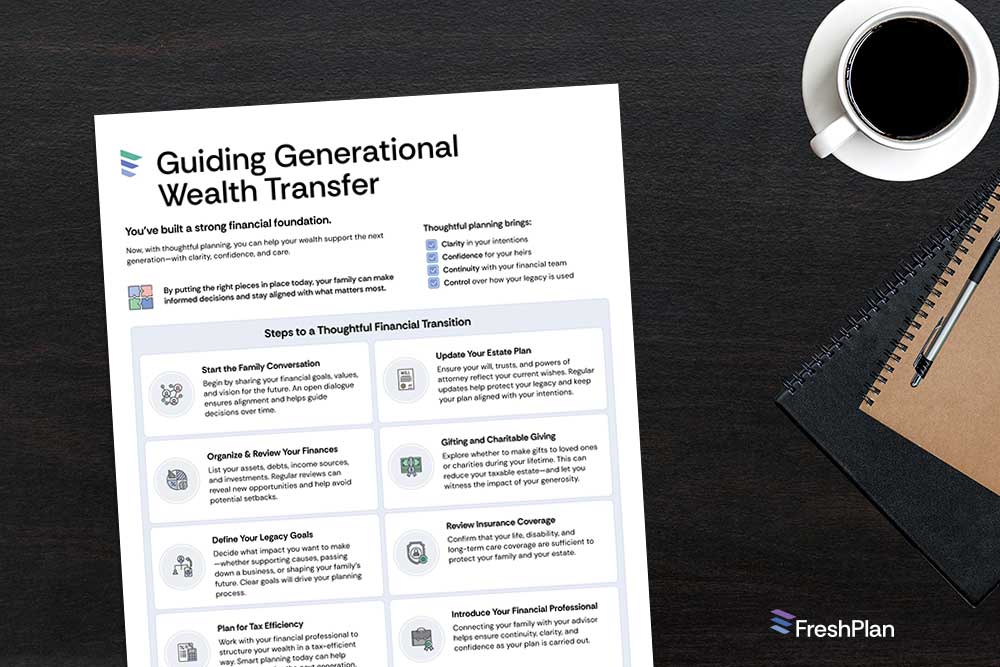
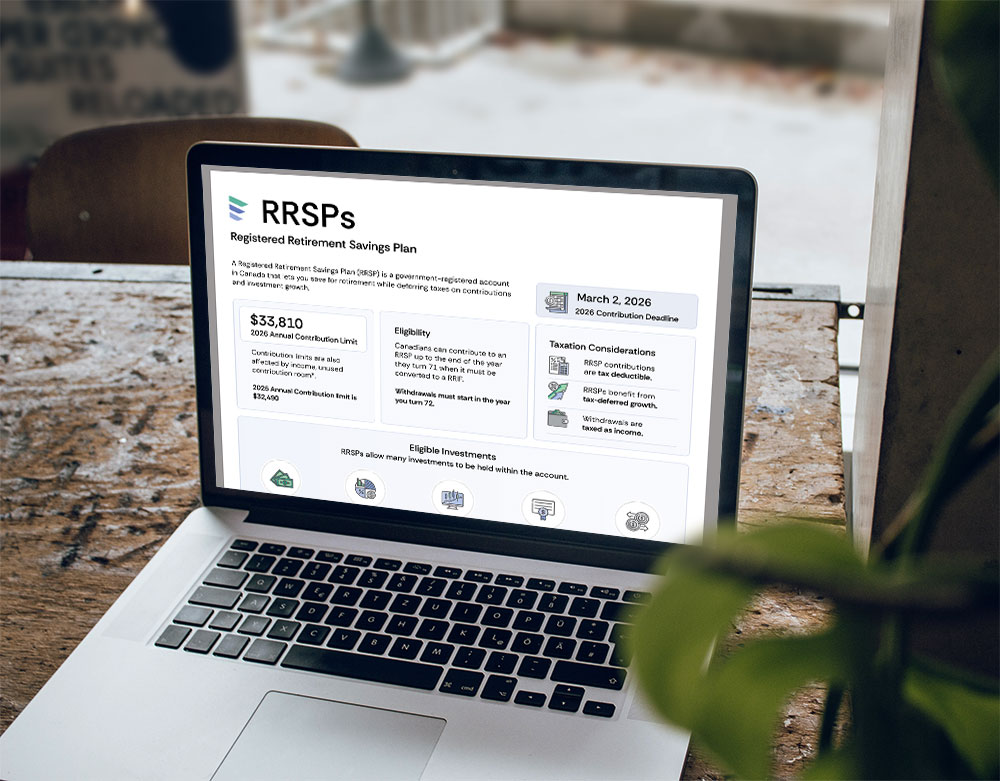
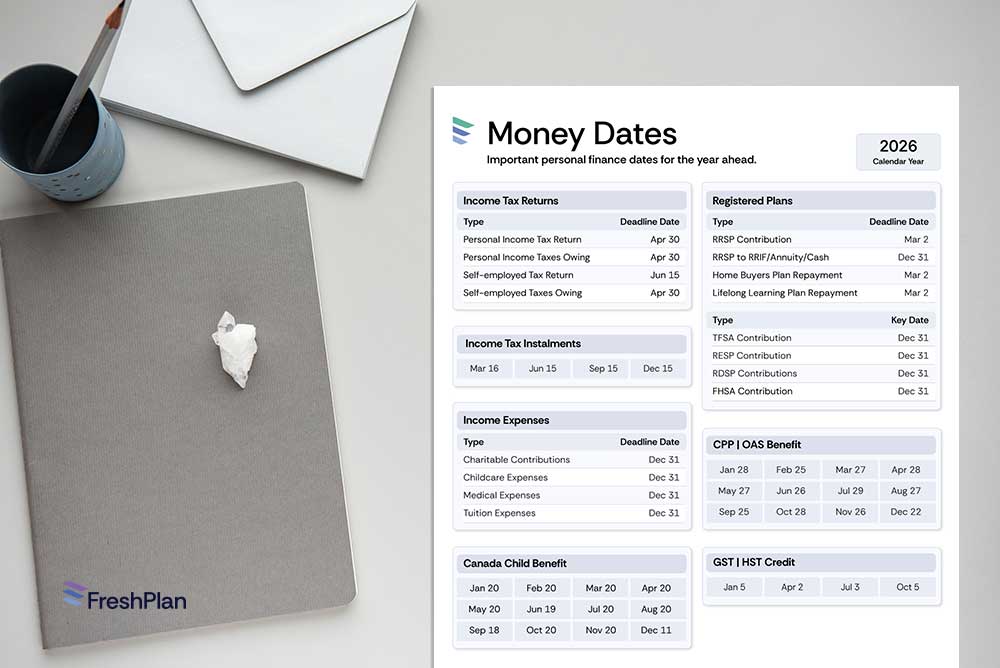
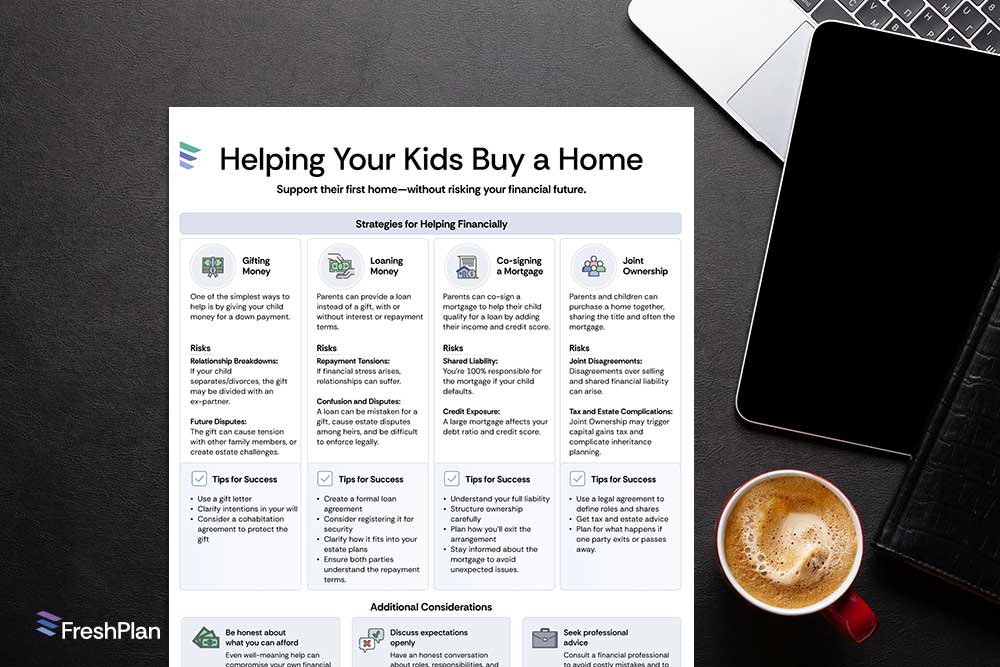
FreshPlan’s infographics turn complex financial topics into clear, compelling visuals your clients can grasp in seconds. Whether you’re answering a quick question, building a full plan, or nurturing relationships between meetings, these visuals make your advice easier to explain—and harder to forget.
Smarter Conversations Start with Clarity
With FreshPlan infographics, you spend less time explaining and more time connecting. Use them to spark engagement, simplify decisions, and reinforce the value of your advice—without slowing down your workflow.


From planning tool to marketing engine.
Grow Your Practise
FreshPlan’s infographic library isn’t just for education—it’s a powerful way to grow your practice. Share visuals in client reports, onboarding kits, follow-up emails, or social media posts. When your advice is easy to understand, it’s easier to share—and that builds trust and visibility.
What’s clear gets shared. What’s shared builds your brand.

Stay Engaged Year-round
Keep your clients informed and connected—even between review meetings.
Use infographics for:
- Timely follow-ups
- Email newsletters
- Social media content
- Educational webinars
- Referral-friendly touchpoints
Without building a full plan every time.
Infographics that are always relevant, easy to access, and ready to use.
FreshPlan’s infographics cover every major area of personal finance.